Charts Classifier Using CNN
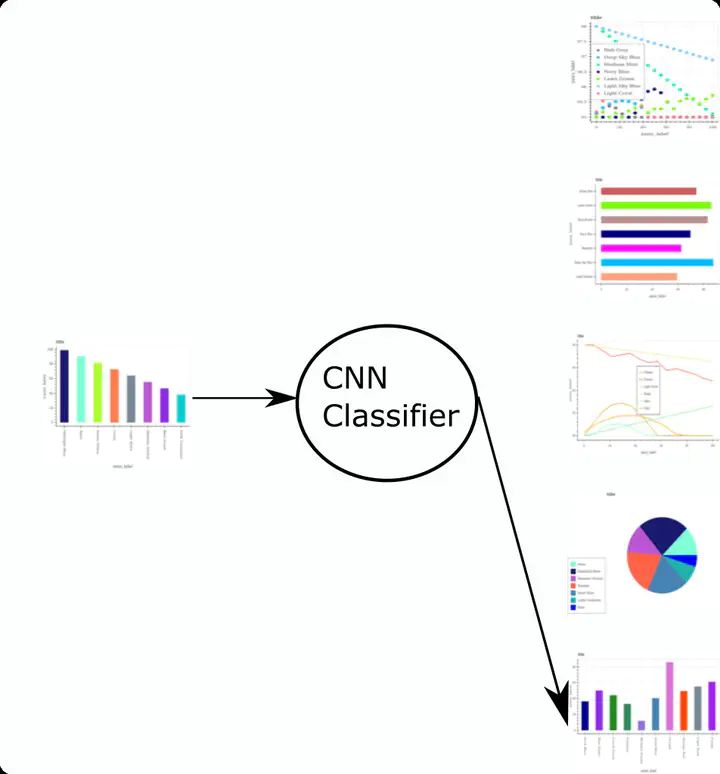 Photo by Dev Soni
Convolution Nueral Network For Classification Of Charts
Task 1 & 2 : Image Sorting & Result of Trained Models
Image sorting
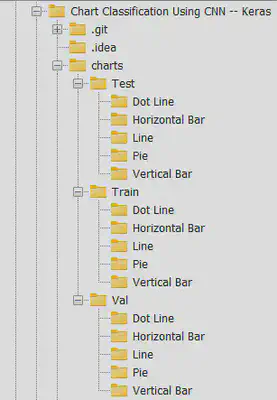
All charts transfered to Train/(spesific folder) as their labels and randomly 20% images transfered into validation folder. Also, images separated in test/(particular) folder, checkout mentioned structure.
This will make labling process much easier with the help of ImageDataGenerator function.
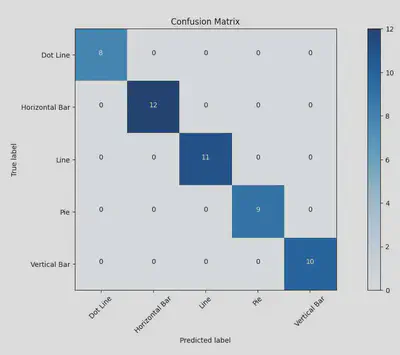
Model Results
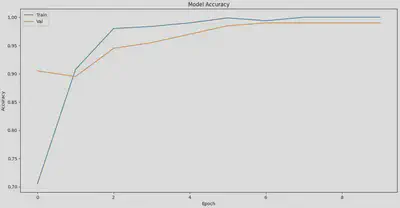
Both Models trained for 10 epochs.
Model 1: 2, 2D Conl layers with 16- 3X3 & 32-3X3 filters, each has a MaxPooling layer of 2X2, got 97% accuracy for validation set, and 96% for test set. Saved Model, Script
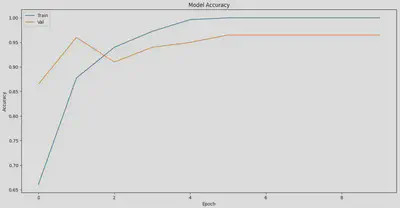
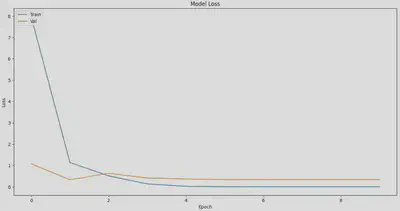
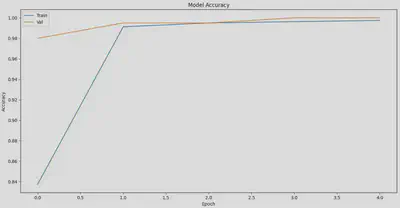
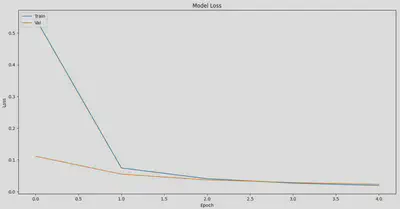
Model 2: 2, 2D Conl layers with 32-3X3 & 64-3X3 filters, each has a MaxPooling layer of 2X2, got 98% accuracy for validation set, and 98% for test set. Saved Model, Script

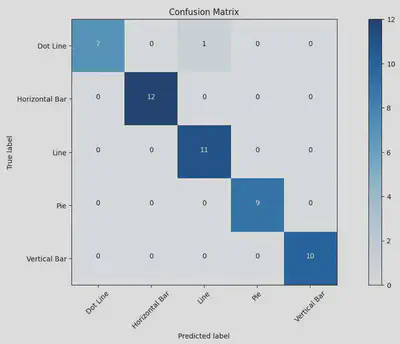
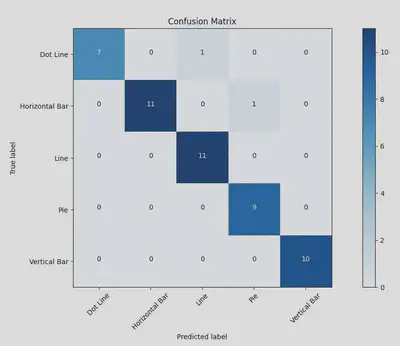
CNNs works same as humas brains they did mistake in recognizing doted line and line, I think that was most difficult for them.
Task 3: Fine Tuning of Pretrained Models
Updated VGG16 pretrained award winning model. Where, I changed last 1000 layer prediction to 5 prediction and froze all the weights insted of last layer’s weights and trained model for just 5 epochs, and got 100% accuracy for both validation and test sets.
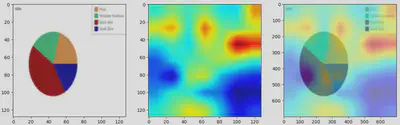
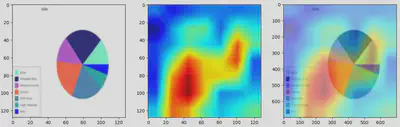
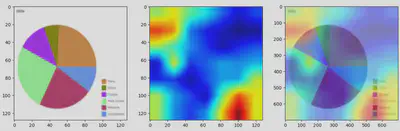
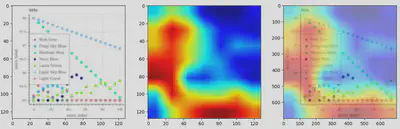
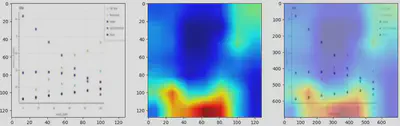
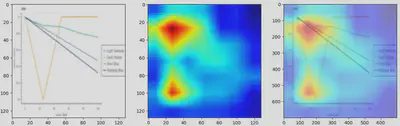
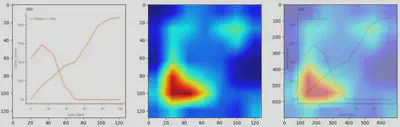
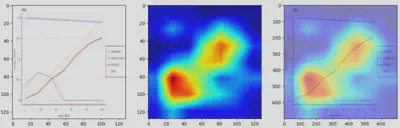
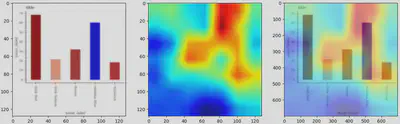
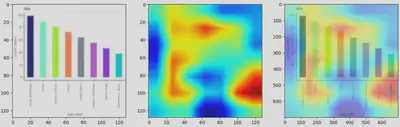
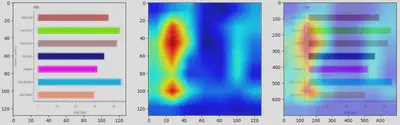
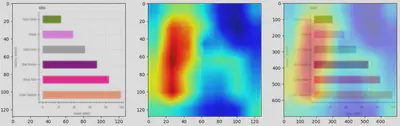
Task 4: GradCAM
Dot Line
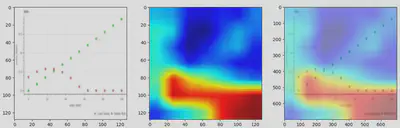
Line
Vertical Bar
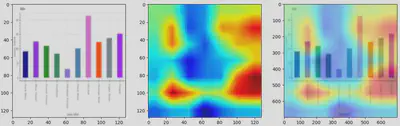
Horizontal Bar
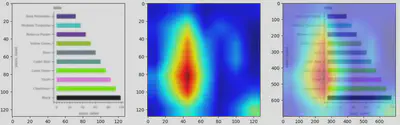
Pie